There is always a question lingering in our clients minds: are the current home prices in South Florida overinflated? It’s a question we hear from buyers from Palmetto Bay all the way to Coral Springs… Understandably so, every buyer wants to make sure they are not paying more than they should. We are traumatized from seeing our friends and loved ones who did in fact buy in an overinflated market suffered the crash, and many paid the consequences.
At the AV Real Estate Group, our goal is to help our clients make educated decisions. Not based on feelings or subjective criteria, but on what the numbers tell us. A week ago, the National Association of Realtors (NAR) released their latest Existing Home Sales Report. The report brings to light an answer to that question, hoping to ease the mind of Home Buyers in South Florida:
"The median existing-home price for all housing types in January was $240,500, up 5.8 percent from January 2017 ($227,300). January’s price increase marks the 71st straight month of year-over-year gains."
Seventy-one sequential stretches of increments may have some worried that present home values might be overinflated.
In a similar report, Zillow issued an official statement which said:
"If the housing bubble and bust had not happened, and home values had instead appreciated at a steady pace, the median home value would be higher than its current value."
Here are two graphs that demonstrate why home costs are precisely where they ought to be. The first graph demonstrates actual median home sales price from 2000 through 2017.
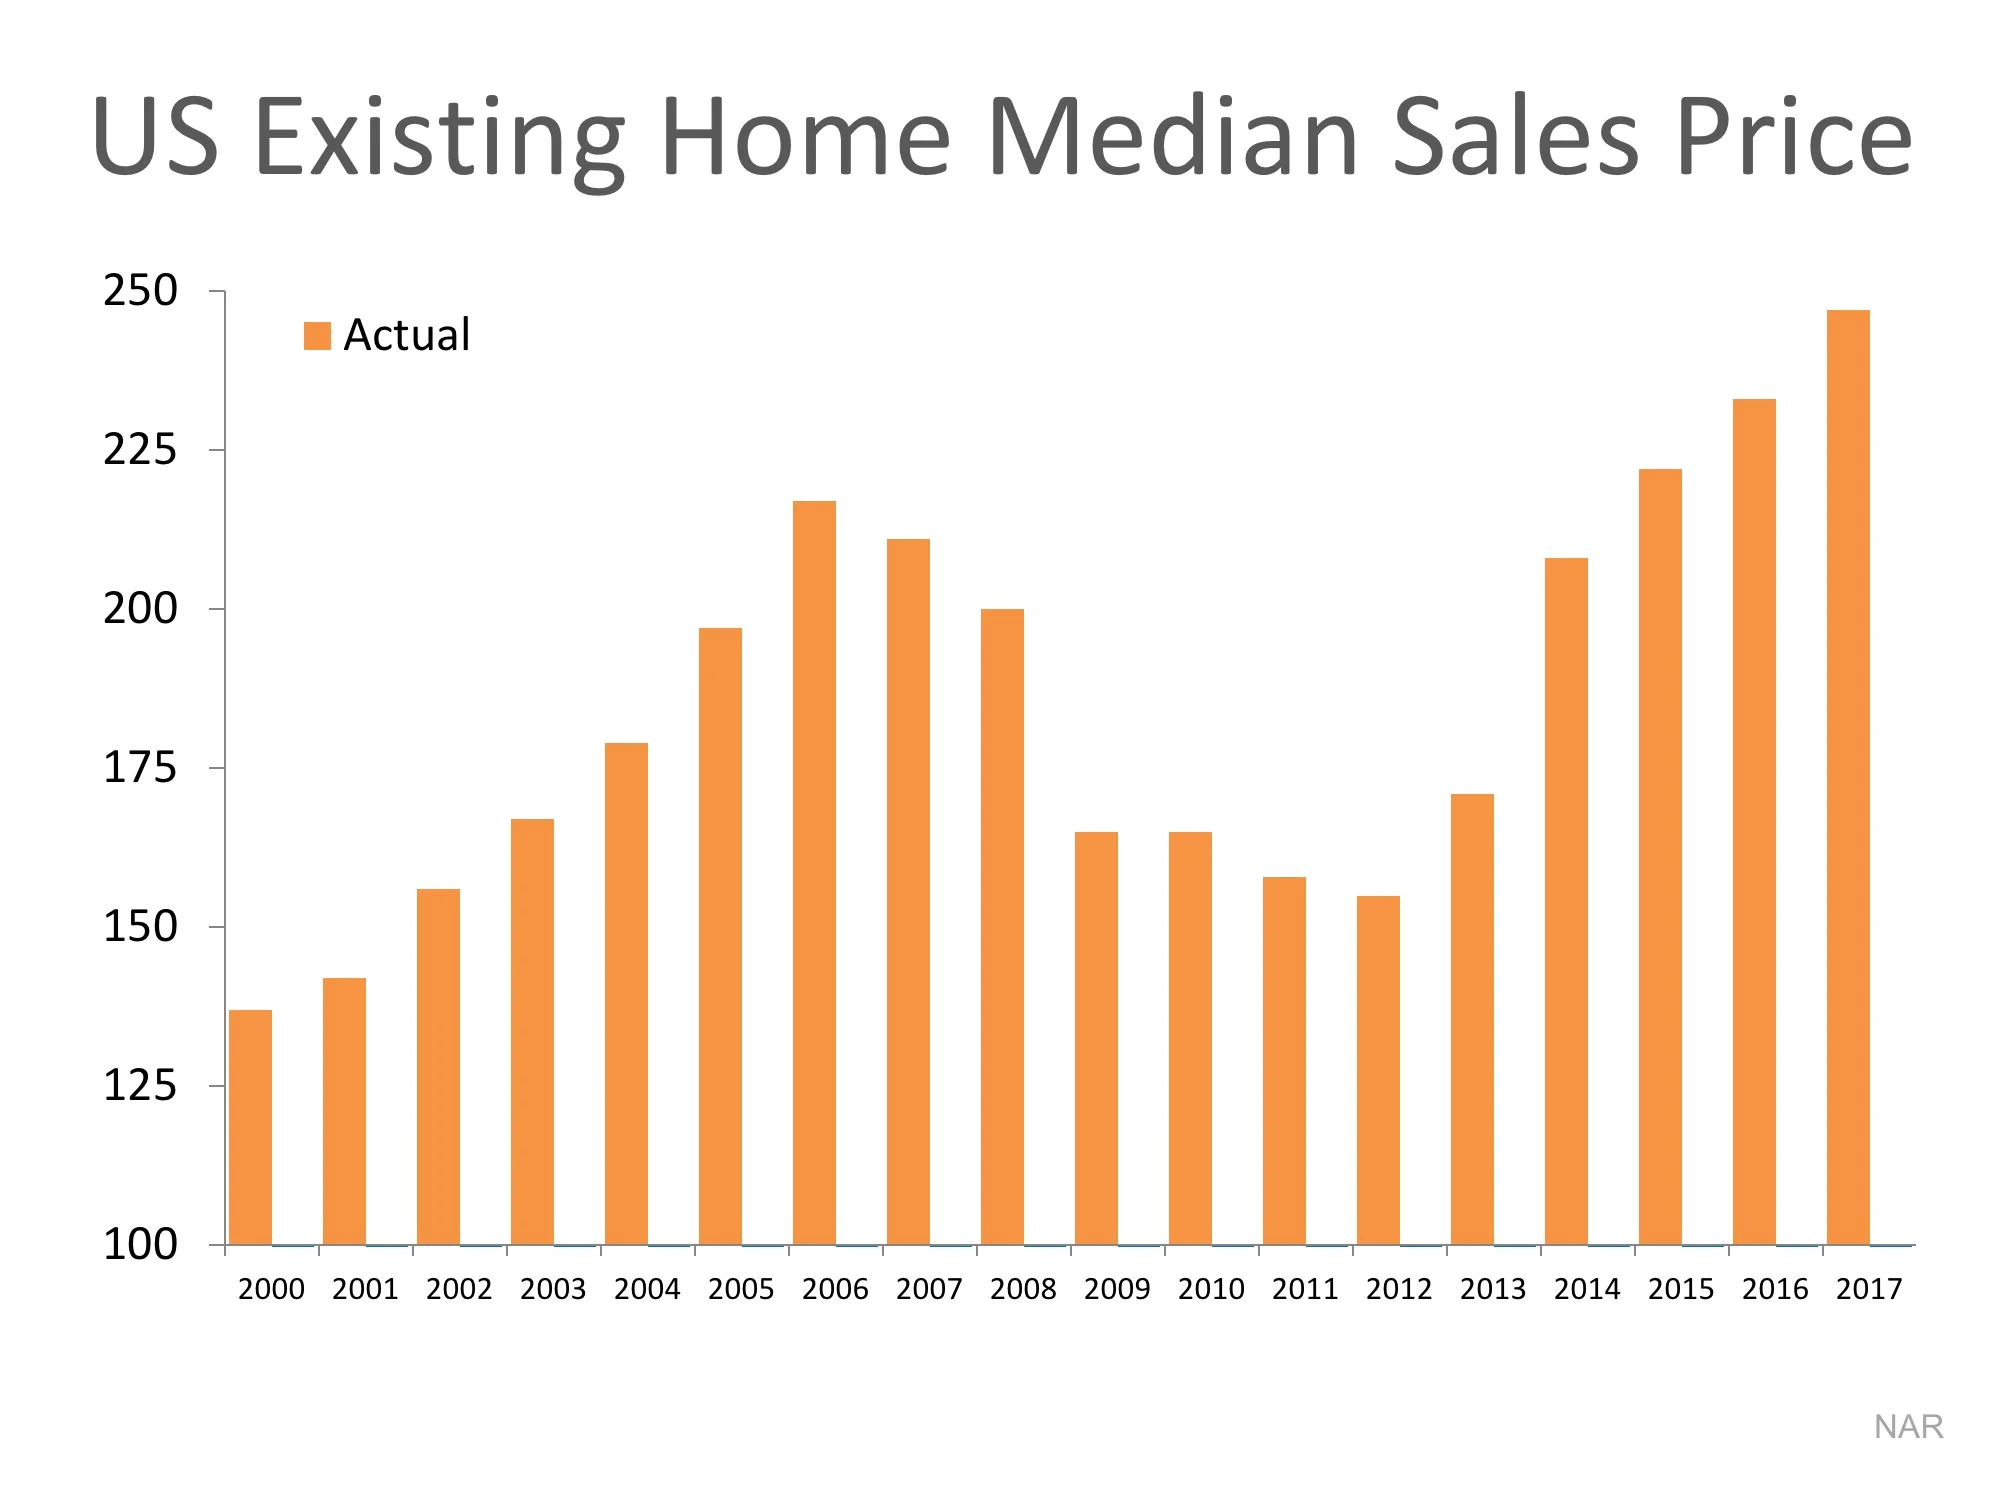
Without anything else, this chart could be worrisome as it indicates home values rose in the mid 2000s, came tumbling down and are currently headed up once more. It almost gives you an impression that you’re on a rollercoaster ride, giving many buyers the expectation that the market is going to take another turn downward.
Regardless, lets take a step back and look at what the numbers tell us… if we were to include into our previous graph what prices would be, had there not been a boom and bust, would we still get the impression of being on a rollercoaster?
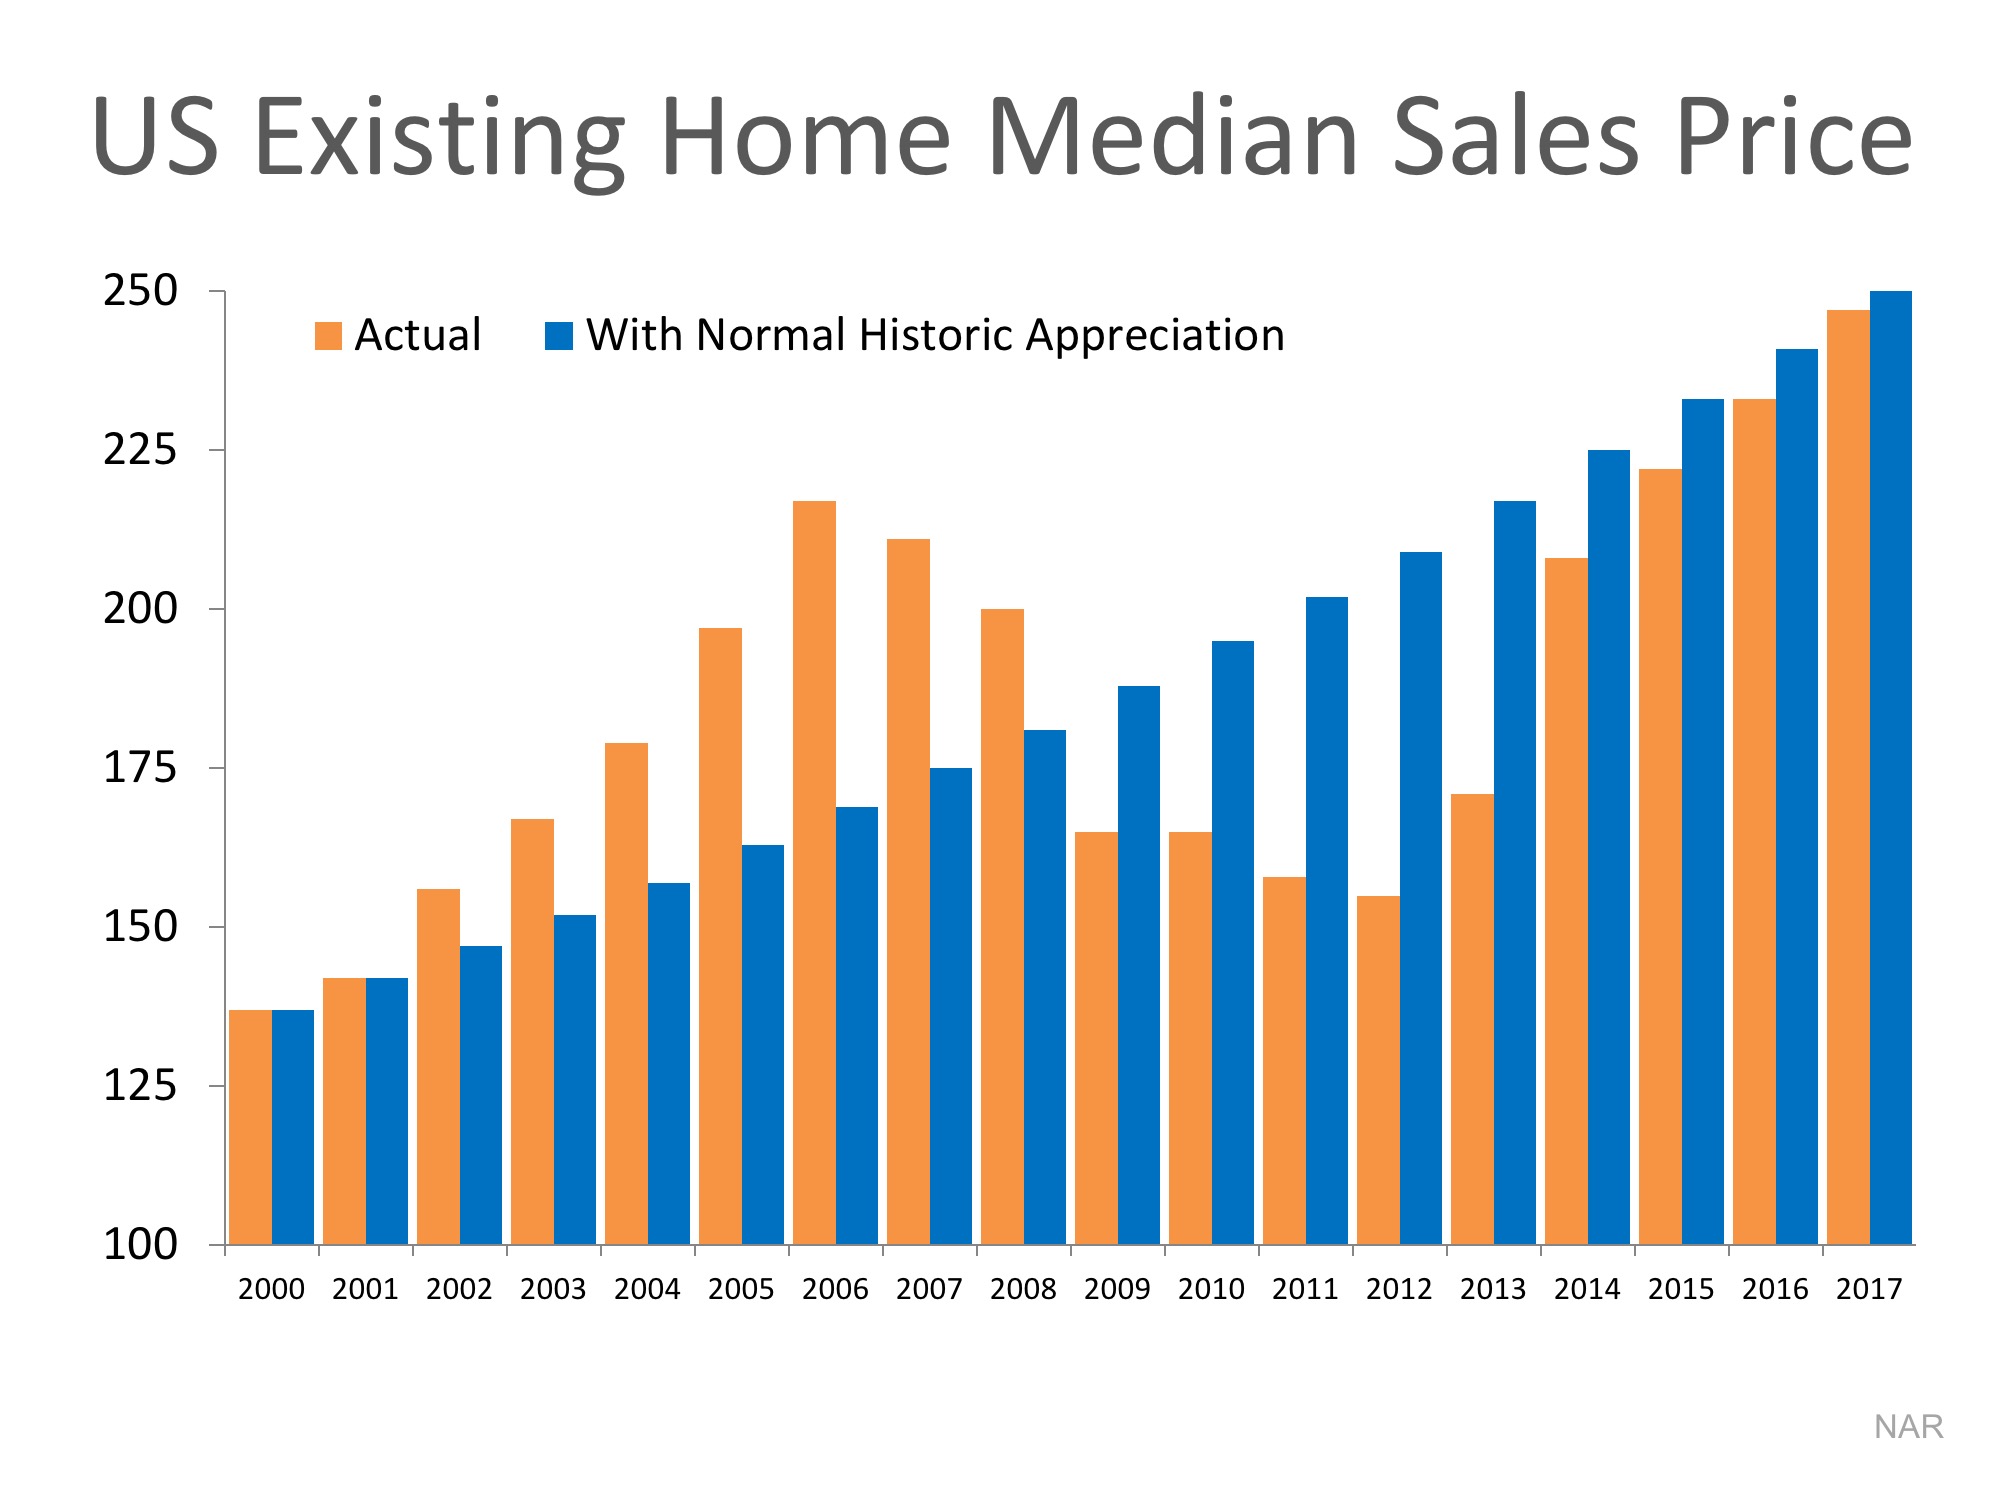
The blue bars on this diagram tell us where costs would be in the event that they had increased at a typical yearly appreciation rate (3.6%). By adding 3.6% to the actual 2000 price and repeating that for each consecutive year, we can see that prices/homes were overvalued during the boom, undervalued during the bust, and currently they are a tad LOWER than where they ought to be at the present time following the typical appreciation rate.
What does this mean for today's home buyer in South Florida?
Although these are national averages, the same holds true for home buyers in Miami-Dade, Broward County, and Palm Beach. Simply basing ourselves on historic appreciation levels, the data tell us current prices/home values are not overinflated but rather where they should be.